Playing Our Part to Advance Governance in Africa: Africa Integrity Indicators – 5th Round – Now Available!

Elsa Peraldi, Project Lead – Africa Integrity Indicators
July 10, 2017
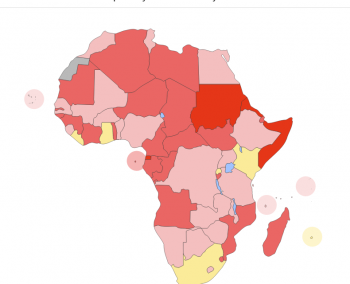
Global Integrity has, for the past 5 years, assessed governance and accountability in all 54 countries in Africa through the Africa Integrity Indicators project. The fact that we’ve now done this five times has allowed us to identify trends, and monitor progress as well as setbacks.
During this time, we have learned about how to best assess certain concepts through the use of proxies — our indicators — and we have continuously enhanced and tweaked our methodology. This past year, we changed some indicators and we took extra steps to review our data, ensuring that all our data reflects our refined criteria throughout the different rounds.
Since launching our preliminary data in early April this year, we have been trying to reach as many governments and civil society as possible to help us polish our data before making it final. Following this process, we are now pleased to announce that the fifth round of the Africa Integrity Indicators is finalized and encourage you to explore our final data here.
What have we learned from our feedback process? How has our data changed?
The African Integrity Indicators is a real-time annual research process that follows our unique methodology. Given its time-bound nature – and in addition to other various reasons – we usually do not do retroactive research to address or amend data from previous years. However, this year, we made an exception and took extra time to go through historic data to identify outliers – possible errors – based on a more holistic understanding of the time series aspect of the data. Doing so, we identified a few indicators where a slight score change, up or down, resulted in a better representation of the narrative in comparison to the score, synchronizing and enhancing the data overall. We are very happy with the results and confident our data will continue to serve as a tool for stakeholders to identify entry points to advance governance reforms.
In addition, and for the second time in the history of the AII project, we also opened a two-month window to receive feedback from stakeholders. This process has proven useful in identifying missing information and adding additional context information to select narratives. Thanks to the feedback received from the governments of Mauritania and Togo we were able to adjust a few scores and the corresponding narrative.
How to make the data more attractive?
How can we make our data more attractive and easy to read for a larger audience? This is a question data-driven organizations face constantly. At Global Integrity we have explored different ways to make our data available; this year the Africa Integrity Team decided to get on the visual communications bandwagon, while at the same time pursuing a more focused approach.
The AidData report Who uses Data and Why?’ highlighted the importance of dissemination channels through which data is shared, and its presentation. So we decided to test a new way to present our data in this fifth iteration by not producing findings for each country and all topics covered by the Africa Integrity Indicators (see our country and thematic findings from round 4 here) but to share a few select findings distilled by the team. Our hope is that these focused findings will spark interest among governments and civil society and prove to be an easier entry point to dialogue and engagement.
This year our thematic findings are focused on seven topics that we believe are timely and add value to the already overwhelming sea of governance information. They are designed to be an entry point and to provide an introductory view of a particular topic. Having said this, our rich data lends itself to a much deeper dive, particularly to identify areas of improvement based on specific interests you might have.
At Global Integrity we believe that data producers need to shift their focus much more towards use and impact of data. How is data used? By whom? And what factors play into making the data more useful to domestic actors? We know that producers need to engage with users and provide opportunities for feedback with the aim of generating data that can inform stakeholders’ efforts to advance governance reforms. Our goal is therefore to get closer to a situation where we allow for meaningful feedback and iterations between data users and us, including by offering a feedback window and by producing focused findings to better catalyze the use of our data.
What have we found?
Committing to make things more concise, focus and used-friendly we decided not to spell out our findings here.
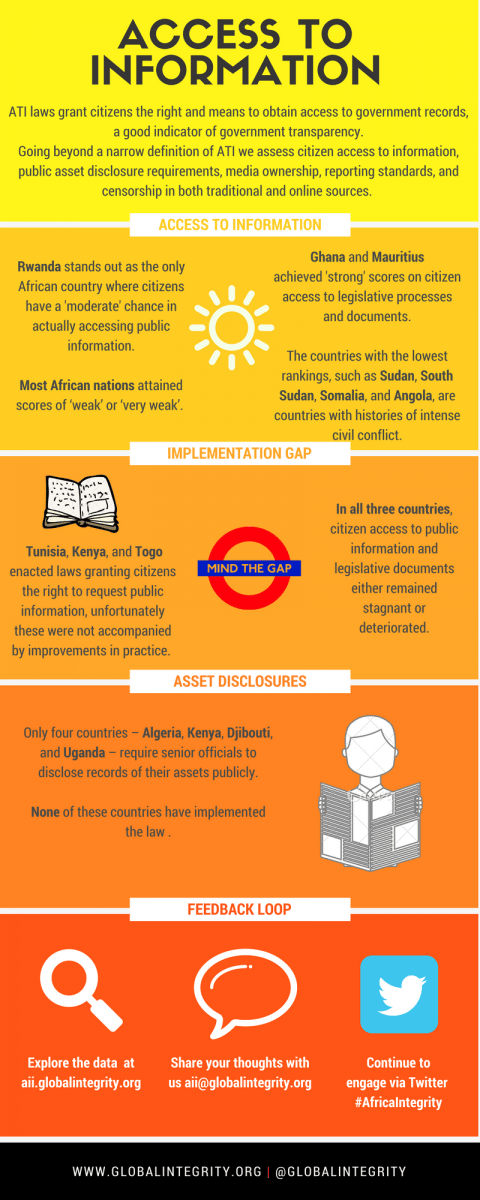
Instead, we invite you to check all seven infographics that cover: Rule of Law, Accountability, Access to Information, Gender, Electoral Transparency, Welfare Transparency and Civil Service Integrity. We encourage you to use them and let us know how our findings could be more helpful for you!

| |
|
| Elsa is a Research Manager and project lead for the Africa Integrity Indicators. |
Leave a Reply